Alice Feng
data analyst and visualizer
interactive visualizations
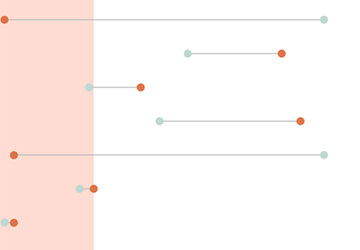
How rigid is the middle class in the US, really?
The Pudding
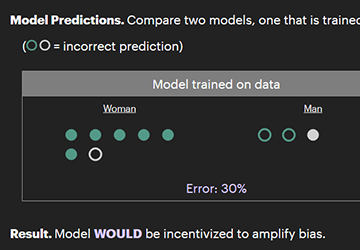
The Myth of the Impartial Machine
Parametric Press Issue 01
Information is Beautiful Awards 2019 Longlist
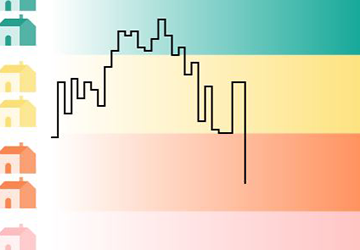
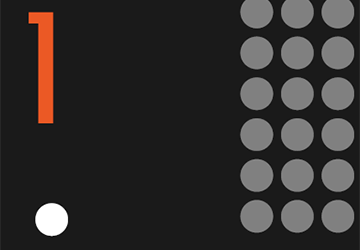
What Does the US Income Distribution Look Like if 1 pixel = $1?
Information is Beautiful Awards 2018 Longlist
Surprise Marriages
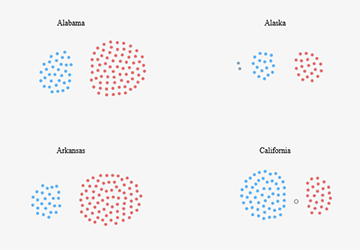
Red and Blue America: The Political Divide at the State Level
How have States Voted in U.S. Presidential Elections?
static visualizations
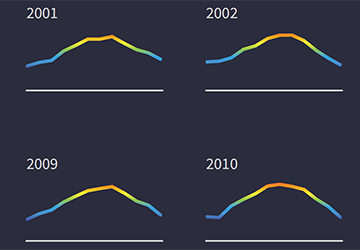
Changing Temperatures
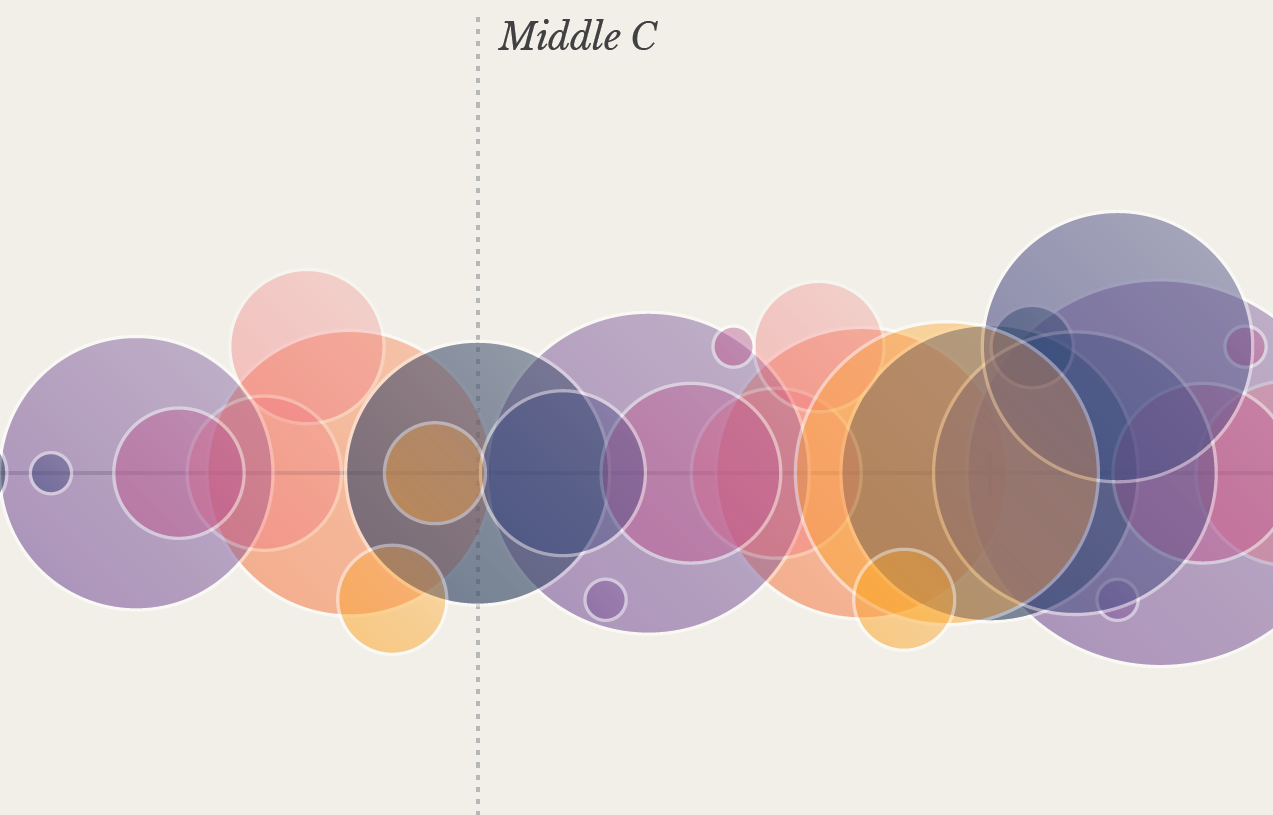
Piano Notes

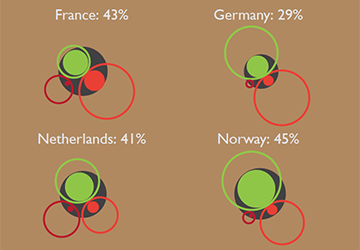
Superstar Countries
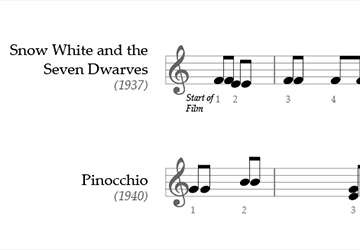
When You Wish Upon a Star: A Visualization of Songs in Disney Animated Films
Information is Beautiful Awards 2017 Longlist
Access to Higher Education is Not Equal
WikiProgress Visualizing Well-Being Contest Winner
CEO-to-Worker Pay Ratio
professional work
State-by-State Guide to the 2020–21 Pandemic EBT Program
Tracking Financial Vulnerability in the UK
Where to Prioritize Emergency Rental Assistance to Keep Renters in Their Homes
Free for All? Investigating Who Would Get Free College
Where the 2020 Presidential Candidates Stand on Tax Policy
Disrupting Food Insecurity: Tapping data for strategies that tackle the root causes
Measuring Student Poverty: Dishing Up Alternatives to Free and Reduced-Price Lunch
Closing Equity Gaps in DC's Wards and Neighborhoods
Which Colleges Are Helping Create a Diverse Teacher Workforce?
writings
Do No Harm Guide: Applying Equity Awareness in Data Visualization — The Urban Institute
Are Your Data Visualizations Racist? — SSIR
Six Ways to Bring Empathy into your Data — Nightingale
Considerations for Ensuring Data Aggregation Is as Inclusive as Possible — Urban Wire
Three Ways Gatekeepers Can Further Racial Equity Awareness in Research — Urban Wire
Combining Racial Groups in Data Analysis Can Mask Important Differences in Communities — Urban Wire
Racial and Ethnic Disparities in Food Insufficiency Persist during the Pandemic — Urban Wire
about me
I am an experienced data analyst with a background in statistics and economics. I have worked in both the public and private sectors, analyzing data to answer public policy questions and drive business decisions. I am familiar with using public datasets as well as user-generated clickstream data.
In my spare time, I love diving into data visualization and exploring how to communicate data insights in more visually appealing and impactful ways. My work has won awards and been presented at conferences.